Do you want to be average? Maybe yes. Maybe no.
When it comes to credit card debt, being average gives you an idea of how much other people owe. That amount could be comfortable for you, or it could be more or less than you feel you can manage with your income and financial situation.
Regardless of whether average is right for you, it gives you a benchmark against which to measure yourself. Is your credit card debt similar to everyone else’s? Or do you owe a lot more or less than other people who are like you in terms of age, state, income, or FICO credit score?
Read on to find out.
-
Navigate This Article:
Total Credit Card Debt in the US
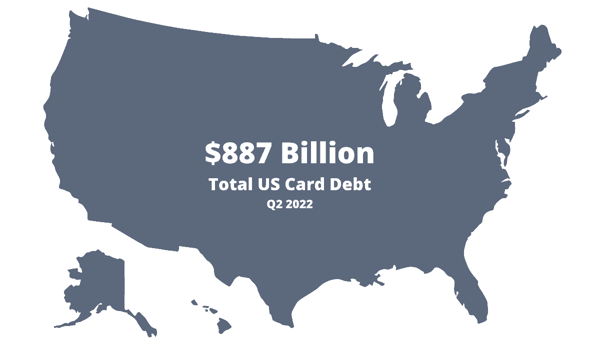
The total credit card debt among US consumers rose to $887 billion in the second quarter of 2022, according to data from the Federal Reserve Bank of New York. Credit card balances saw their largest year-over-year percentage increase in more than two decades.

The good news is that delinquency rates are still very low compared with historical delinquencies. But prepare for those balances to increase even more as we approach the holiday shopping season.
Average Individual Credit Card Balance
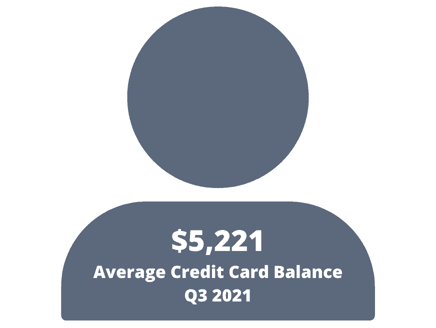
US consumers lowered their average individual card debt in 2021, though not by as much as they did in 2020. According to Experian, the average credit card balance in the third quarter of 2021 was $5,221 — 1.8% lower than the average balance of $5,315 in the third quarter of 2020.

In 2019, the average card balance was significantly higher at $6,239.
Though average and total balances declined, US consumers continued to open millions of new card accounts. The total number of cards in the US grew to more than 494 million in 2021, up from almost 480 million in 2020 and about 465 million in 2019.
Those figures total 14.7 million new card accounts in 2021 after an increase of 14.5 million new card accounts in 2020 — a total approaching 30 million in just two years.
Average Credit Card Debt By Age
Among all the demographics, Generation X — defined in Experian’s report as aged 41 to 56 — had the largest average card debt balances in the third quarter of 2021. Those consumers had an average balance of $7,070 in that period.
But despite their heavy debt load, Gen Xers managed to lower their average debt by 1.3% compared with the prior year’s third quarter. That feat separated them from the two younger demographic cohorts, which increased their average debt. The two older demographic groups also decreased their average debt.
- Meanwhile, Gen Z — defined as those aged 18 to 24 — increased their card debt by an average of 11.6% to $2,282 in the third quarter of 2021.
- Millennials — defined as those aged 25 to 40 — increased their card debt by 5.2%, to $4,576, on average.
- Baby Boomers — defined as those aged 57 to 75 — decreased their card debt by 4.7% to $5,804, on average.
- The Silent Generation — defined as those older than 75 — decreased their card debt by an average of 3.1% to $3,177.
Average Credit Limits By Age
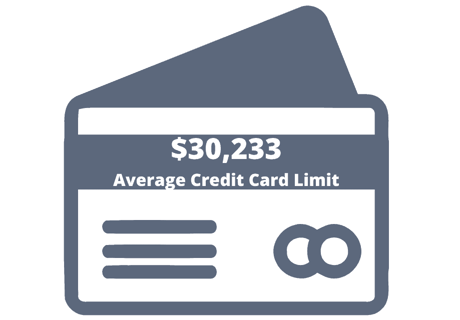
Perhaps due to the lingering effects of the COVID-19 pandemic, the average card credit limit shrunk slightly to $30,233 in 2021 compared with $30,817 in 2020 and $31,459 in 2019.

Lower balances and tighter credit limits produced lower utilization ratios, which dropped from 29% in 2019 to 25% in 2020 and 2021. But those figures varied widely by age.
- Baby Boomers had the highest credit limits at an average of $38,898, which was statistically unchanged from 2020’s third quarter to 2021’s third quarter.
- Gen X’s card limits averaged $33,694 in 2021’s third quarter, up 1.5% from the same period in 2020.
- The Silent Generation’s credit limits averaged $31,937, down 1.3%.
- Millennials earned credit limits averaging $22,136, up 4.4%.
- Gen Z’s limits rose 6.7% — the largest expansion of credit — to $9,857.
Average Credit Utilization By Credit Score
Credit card utilization ratios in 2021 varied widely when sorted by consumers’ FICO credit scores. Predictably, the higher the credit score, the lower the utilization ratio:
- Consumers with exceptional credit scores, defined in the report as 800 to 850, had an average utilization ratio of 6.4%.
- Consumers with very good scores, defined as 740 to 799, had an average utilization ratio of 15%
- 34% for consumers with good scores, defined as 670 to 739
- 50% for consumers with fair scores, defined as 580 to 669
- 64% for consumers with poor scores, defined as 300 to 579
Average Credit Card Debt By State
Alaska residents led the US with the highest average credit card debt — $6,787 per resident — in the third quarter of 2022, Experian reported.
Connecticut and New Jersey came in second and a very close third with an average credit card debt of $6,516 and $6,428 per resident, respectively.
Eight other states with average card debt exceeding or closely approaching $6,000 per resident were:
- Maryland ($6,276)
- Virginia ($6,249)
- Texas ($6,194)
- Florida ($6,050)
- Georgia ($5,994)
- Hawaii ($5,972)
- Colorado ($5,915)
- New York ($5,883)
Iowa once again ranked dead last with the lowest average card debt of just $4,609 per person in the third quarter of 2021. Also at the bottom were Wisconsin ($4,628), Kentucky ($4,734), and Mississippi ($4,741).
Nine other states with average card debt in the $4,800 to $5,000 range were (in alphabetical order): Arkansas, Idaho, Indiana, Maine, Michigan, North Dakota, Oregon, Vermont, and West Virginia.
Average Credit Card Debt by Income
People who earn more income tend to have more credit card debt, according to 2019 data from the Federal Reserve Survey of Consumer Finances.
Consumers in the three lowest income percentiles, with median annual incomes of $16,290, $35,630, and $59,050, had average credit card balances of $3,830, $4,650, and $4,910, respectively.
Consumers in the three highest income percentiles, with median annual incomes of $95,700, $151,700, and $290,160, had average credit card balances of $6,990, $9,780, and $12,600, respectively.
The percentage of consumers in each income group that carried credit card debt bulged in the middle-income groups. The three lowest income groups posted 30.5%, 45.6%, and 55%, respectively, while the three highest income groups clocked in at 56.8%, 45.9%, and 32.2%, respectively.
How to Lower Your Credit Card Debt
Some people are comfortable with the amount of debt they have, but others want to lower their debt. If you’re in that group, you can use two main strategies to get started.
The snowball strategy starts with paying off your smallest balance first, then your next smallest balance, and so on until you pay off your last and largest debt. This strategy may cost you more as your interest expense may be higher, but it can help you stay motivated.
The avalanche strategy starts with paying off the debt with the highest interest rate first and then paying the account with the next highest interest rate, and so on until you pay off your last and lowest-rate debt. This strategy may take more motivation but can help you save more on interest fees.
You can also alternate between the two strategies or combine them in any way that works well for you.
Consolidating or refinancing your card debt with a lower rate may make it easier for you to pay down the amount you own. A balance transfer card with an introductory 0% rate for transfers may be one way for you to refinance some of your credit card debt with a lower or 0% rate.
Paying down your debt may make you below average — in a good way.
Advertiser Disclosure
CardRates.com is a free online resource that offers valuable content and comparison services to users. To keep this resource 100% free, we receive compensation for referrals for many of the offers listed on the site. Along with key review factors, this compensation may impact how and where products appear across CardRates.com (including, for example, the order in which they appear). CardRates.com does not include the entire universe of available offers. Editorial opinions expressed on the site are strictly our own and are not provided, endorsed, or approved by advertisers.


![Average Credit Card Debt by Age in [current_year] Average Credit Card Debt by Age in [current_year]](https://www.cardrates.com/images/uploads/2023/05/CR-AverageCreditCardDebtbyAge.jpg?width=158&height=120&fit=crop)
![Average Credit Card Debt by State in [current_year] Average Credit Card Debt by State in [current_year]](https://www.cardrates.com/images/uploads/2023/06/CR-AverageCreditCardDebtbyState-1250X650.jpg?width=158&height=120&fit=crop)
![Credit Card Ownership By Age, Income, Gender & Race in [current_year] Credit Card Ownership By Age, Income, Gender & Race in [current_year]](https://www.cardrates.com/images/uploads/2021/01/shutterstock_1524276980.jpg?width=158&height=120&fit=crop)
![[current_year] Credit Card Debt Statistics (Average U.S. Debt) [current_year] Credit Card Debt Statistics (Average U.S. Debt)](https://www.cardrates.com/images/uploads/2018/04/shutterstock_243114739-edit.jpg?width=158&height=120&fit=crop)
![7 Credit Cards For High Debt-to-Income Ratios ([updated_month_year]) 7 Credit Cards For High Debt-to-Income Ratios ([updated_month_year])](https://www.cardrates.com/images/uploads/2021/01/shutterstock_232260670.jpg?width=158&height=120&fit=crop)
![Average Credit Card Debt in American Households ([current_year]) Average Credit Card Debt in American Households ([current_year])](https://www.cardrates.com/images/uploads/2018/01/avgdebt.png?width=158&height=120&fit=crop)

![Average Credit Card Debt by Country in [current_year] Average Credit Card Debt by Country in [current_year]](https://www.cardrates.com/images/uploads/2023/06/CR-AverageCreditCardDebtbyCountry-1250X650.jpg?width=158&height=120&fit=crop)