In a Nutshell: Today, companies have access to billions of gigabytes of data, yet only 0.5% of it is ever analyzed. This information explosion has created both opportunities and challenges, especially in retail, where legacy systems and IT resources have hindered analysts from compiling, integrating, and acting on all that data. Tableau, an analytics platform based on principles of interactive visualization, provides an easy-to-use solution for organizations who want to dig deeper into their data, ask questions, and make faster business decisions. With drag-and-drop capabilities that support hundreds of data sources, Tableau enables businesses to accurately analyze data in minutes rather than weeks or months.
Most of the data in existence today was generated within the last two years, and, by 2020, it is predicted that we will be generating 1.7MB of data every second for each human on earth — the equivalent of digitizing every word ever spoken in the history of mankind. But despite the massive amount of information this represents, only 0.5% of this data is ever analyzed.
Today’s business analysts have access to information from the most advanced data-gathering systems, but finding a way to compile and make sense of it is still difficult. Unless analysts can code, it’s often impossible to draw multiple data sources into one format that’s easy to read and draw connections from without first handing it off to the IT department.
Launched as a Stanford University research project focused on creating a user-friendly combination of computer graphics, databases, querying, and human-computer interaction, Tableau is a platform for businesses to compile diverse data sources faster — and with better visualization — leading to informed decision-making and forward thinking.
“For people with traditional legacy systems, every question is an IT project,” said Jeff Huckaby, Market Segment Director for Retail and Consumer Goods at Tableau. “Data moves quickly in retail these days, so every question can’t be an IT project.”
Data analysis is vital to making business decisions as well as catching sales opportunities, identifying outliers, improving efficiency, and maximizing marketing efforts based on customer habits and response.
“It’s our core mission to help people see and understand data. The people who know the data should be the ones who are enabled to ask questions,” Jeff said. “One way we help is by providing an enterprise data visualization platform at mass scale for organizations. That leads to more people asking questions and gaining a deeper understanding of the data.”
Tableau makes it easy for anyone to analyze diverse data sets, whether they are an experienced analyst or a novice business owner. With a simple, yet robust, set of tools, Tableau produces data visualizations that are as easy to understand as they are to act on.
Consolidating Data into an Interactive, Drag-and-Drop Interface
Even with modern tools that pull performance metrics, retailers face the struggle of exporting data from various sources into formats that are easy to analyze. With Tableau, business analysts and executives can connect multiple data sources without having to manipulate code or manually transfer information to hard-to-read tables.

Jeff Huckaby, Tableau Market Segment Director for Retail and Consumer Goods, talked to us about the company’s data visualization solutions.
“If you had data in a marketing application that was in Amazon Redshift, but you also had some inventory or store brick-and-mortar data from a POS system in a Teradata warehouse on premise, you can put those two together,” Jeff said. “You can just drag and drop and it will query the backend database automatically.”
That means nearly any data a business has access to can be analyzed, as Tableau supports hundreds of sources — including wifi, robotics, Web APIs, Twitter feeds, POS systems, RFID tags, and even logistics and transportation systems. Every aspect from marketing to supply chain operations can be visually analyzed in Tableau.
“A million products, a year’s worth of data — a company can visualize that all at once and instantly identify areas to focus on,” Jeff told us.
Tableau users can also interact with this data using three products: Tableau Desktop for data prep and analysis; Tableau Server for enterprise-level storage and collaboration; and Tableau Online, with cloud storage and sharing built in. Users can also explore published visualizations through their mobile devices.
With access to more formats, companies that use Tableau for analytics can get a detailed picture of their entire operation in close to real time.
Intuitive Software Designed to Inspire Data Exploration
In the world of analytics, an initial question often leads to many more questions, and Tableau is designed to encourage that natural curiosity and discovery process by incorporating scientific principles of human perception and cognition.
Its Live Query Engine allows users to compare their own data sources without advanced programming knowledge using a simple point-and-click interface. And, unlike more rigidly constructed systems, Tableau enables free-form exploration that doesn’t limit how users can combine and process information.

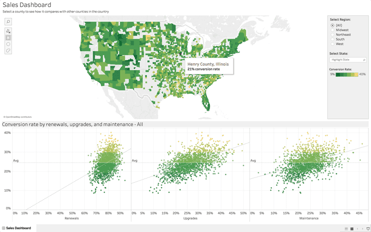
The Tableau dashboard makes it easy for a business owner to drag and drop data in to be analyzed.
Tableau’s software is based on the concept of visual analysis. It doesn’t just convert data into charts and graphs; it integrates the two. In designing its color-coding interfaces and maps, Tableau drew on the knowledge of cognition experts and studied how the human mind processes color. One of the specific tools Tableau engineered is VizQL, a query language that translates drag-and-drop data into visual representations.
“We as humans can analyze visually between 10 and 100 times faster than raw data alone,” Jeff said.
Based on these principles, Tableau’s software uses the way people think and see to help the average person make fast connections and engage more fully with their data.
“Analysts are answering questions they couldn’t even see before,” Jeff said.
Ushering Businesses into a Modern Analytics Landscape
Traditionally, many organizations have used Excel spreadsheets to compile data into tables for analysis, but even these tools have their limits. The more lines and categories, the harder it becomes to identify connections and points of action.
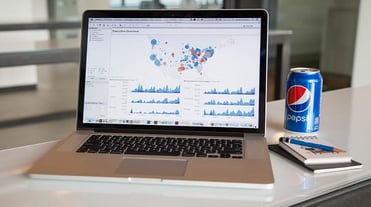
Even well-known companies like Pepsi used to rely on spreadsheets to piece together massive amounts of data. Pepsi worked with Tableau and one of its partners, Trifacta, to gather information from various databases and sources and analyze it in Tableau. By upgrading to a modern analytics system, Pepsi improved its analysis time by 70% and its report production time by 90%.

Tableau enabled Pepsi to stop using spreadsheets and exponentially boost its analytics performance.
Tableau allowed Pepsi to spend more time on advanced forecasting — such as predicting sales to improve on-shelf availability and modifying vendor orders in a way that benefits both parties. With better analytics, Pepsi also strengthened its supplier relationships.
“We’re starting to see retailers and different vendors work better together with data,” Jeff said.
Others, like Arby’s, have used Tableau to verify the profitability of their expansion and remodeling projects, moving forward with confidence that their customers are responding well to the changes.
With Tableau, businesses like Pepsi and Arby’s have moved from static to dynamic analysis methods that allow them to think, react, and move faster to benefit themselves, their partners, and their customers.
Visualizing Analytics Translates to Faster Business Decisions
Even though data collection continues to expand, the ability to sift through that information and put it to use lags far behind, especially in retail. Legacy data analysis processes have failed to keep up with the needs of fast-paced businesses.
“The market for data and making new decisions is paramount,” Jeff said. “You can’t wait six months to make a decision — you need to know within minutes, and that’s what we’re seeing a lot of people do with Tableau.”
As Pepsi and Arby’s have illustrated, the easier a business can see and understand the data it has collected, the faster it can see measurable results. Based on scientific principles of visualization, Tableau’s user-friendly platform makes it easier for businesses to transfer diverse forms of data into one, easy-to-analyze format that allows them to ask — and answer — important questions.
With more than 57,000 companies relying on its analytics software to make decisions, Tableau continues to develop new tools and capabilities to equip retailers for the information explosion — through 2020 and beyond.
Advertiser Disclosure
CardRates.com is a free online resource that offers valuable content and comparison services to users. To keep this resource 100% free, we receive compensation for referrals for many of the offers listed on the site. Along with key review factors, this compensation may impact how and where products appear across CardRates.com (including, for example, the order in which they appear). CardRates.com does not include the entire universe of available offers. Editorial opinions expressed on the site are strictly our own and are not provided, endorsed, or approved by advertisers.


![21 Startling Credit Card Data Breach Statistics ([current_year]) 21 Startling Credit Card Data Breach Statistics ([current_year])](https://www.cardrates.com/images/uploads/2023/10/Credit-Card-Data-Breach-Statistics.jpg?width=158&height=120&fit=crop)
![4 Tips: Getting Business Credit Cards with No Personal Credit Check ([updated_month_year]) 4 Tips: Getting Business Credit Cards with No Personal Credit Check ([updated_month_year])](https://www.cardrates.com/images/uploads/2017/10/biznocredit.png?width=158&height=120&fit=crop)
![6 Guaranteed Installment Loans for Bad Credit ([updated_month_year]) 6 Guaranteed Installment Loans for Bad Credit ([updated_month_year])](https://www.cardrates.com/images/uploads/2018/08/guaranteed--1.png?width=158&height=120&fit=crop)
![7 Best Cash Back Credit Cards for Business ([updated_month_year]) 7 Best Cash Back Credit Cards for Business ([updated_month_year])](https://www.cardrates.com/images/uploads/2020/12/shutterstock_289823318.jpg?width=158&height=120&fit=crop)
![9 Best Air Miles Credit Cards for Business ([updated_month_year]) 9 Best Air Miles Credit Cards for Business ([updated_month_year])](https://www.cardrates.com/images/uploads/2020/12/shutterstock_1054148699.jpg?width=158&height=120&fit=crop)
![8 Business Credit Card Sign-Up Bonuses ($200 to $1250) – [updated_month_year] 8 Business Credit Card Sign-Up Bonuses ($200 to $1250) – [updated_month_year]](https://www.cardrates.com/images/uploads/2021/03/Business-Credit-Card-Sign-Up-Bonuses.jpg?width=158&height=120&fit=crop)
![How to Get a Business Credit Card ([updated_month_year]) How to Get a Business Credit Card ([updated_month_year])](https://www.cardrates.com/images/uploads/2022/01/How-to-Get-a-Business-Credit-Card.jpg?width=158&height=120&fit=crop)