In a Nutshell: The cost of goods and services can affect people’s quality of life, and prices often differ dramatically from one location to another. The Cost of Living Index has quantified price differences for consumers since 1968. The index measures the price of living expenses in a range of categories from groceries to health care based on verified national data and issued quarterly by the Council for Community and Economic Research. It provides a reliable benchmark to evaluate what it costs to live in metro areas across the US.
Imagine you’ve been offered a new job or promotion in an exciting new city. Before you accept, you need to know how far the salary the recruiter is offering will take you in a new city compared with what it costs to live in the city you will leave.
You can either trust that the employer has taken price differences into account before making an offer, or you can perform your own due diligence before signing anything.
Even if the employer is acting in good faith, it is good to do some research because the cost of living differences between metro areas can be significant. The COVID-19 pandemic contributed to more job market fluctuation and inflation, so workers need to understand where cost-of-living increases have had the most impact.

The Cost of Living Index (COLI) helps consumers find cost figures they can trust. COLI looks at data from across the U.S. in six categories: food, housing, utilities, transportation, health care, and miscellaneous goods and services. The index is published quarterly by the Council for Community and Economic Research (C2ER), and it’s not just for job seekers.
State and local governments, chambers of commerce, and economic development organizations use COLI data to attract new businesses and residents. Business site selectors and HR departments leverage COLI to decide where to locate and how much to pay their workers. Realtors use it to price homes.
COLI is an authoritative source for academic and market researchers, as well. Many job seekers consult the index before accepting a new position or promotion. COLI data can simplify those decisions with its comprehensive and updated information and categories.
“After an across-the-board review, we hone in on some of the pieces that are especially sensitive, such as housing,” said COLI Research Assistant Tyler Baines. “By the time the quarter’s over, we’re back to doing it all again.”
Data and Tools for City-to-City Cost Comparisons
Organizations purchase access to COLI data so they can incorporate it in their own content. Job seekers can do the same for a small fee by using COLI’s Click to Compare feature to drill down on price differences in up to five metro areas.
COLI Project Manager Jennie Allison did just that before moving to the Washington, D.C., area to join CREC, the nonprofit that oversees C2ER (and ultimately the index).
“I thought, ‘Well, if I’m going to go work on this project, I’d better use their data to figure out what kind of salary I need to advocate for,’” she said.

Along with Baines, Allison is part of the CREC team responsible for managing COLI partnerships with more than 300 independent data providers. These include universities, city departments, chambers of commerce, and economic development organizations. Its partners report prices on more than 60 goods and services consumers regularly pay for, including steak, eggs, gas, salon services, clothing, rent and mortgage rates, and utility bills.
“It’s an undertaking,” Baines said. “We go through a rigorous three-stage review process to ensure the quality and validity of the data. And we work across those many different organizations and metro areas.”
All of that work produces the Quarterly Index, which has been published continuously since 1968. COLI also publishes tools that examine the relationship between prices and wages using data from another CREC organization, the Labor Market Information Institute. In addition, data extrapolation procedures can shed light on county and state prices and those in smaller municipalities.
Calculate Price Differences Across Metro Areas
An advisory board of academic researchers and government officials monitors and reviews the team’s work. Government agencies, including the U.S. Census Bureau, U.S. Bureau of Labor Statistics, and the President’s Council of Economic Advisors, officially recognize COLI data.
Major online media outlets, including CNN Money and Bankrate.com, use COLI. And consumers often find COLI data cited in publications of record, such as The Wall Street Journal.
Items in the Quarterly Index reflect the six consumer categories as broadly as possible, so consumers get an overall sense of prices. On the most basic level, the index reports average prices for each consumer good in specific metro areas, simplifying direct comparisons.
But government survey data on spending patterns in professional and executive households is also used to weigh the relative impact of each item. So, the average for all prices in all participating metro areas is computed to equal 100.
Scores for items in specific categories fall above or below that average, indicating their relative price value. It averages each of the six category scores again to create a single composite number.
A housing score in the 60s for a metro area in Alabama, for example, indicates a relatively mid-range price market. But a utility score in the 130s in the same area shows that power bills may run high.
A metro area with a composite score of 80 is a much cheaper place to live than somewhere with a composite score of 120.
“COLI doesn’t directly measure inflation, but it does measure what things cost at a single point in time, and you can see these trends across the different items,” Baines said.
COLI: Insights for Making the Most of Your Money
The COLI team generally refrains from assessing why prices are at certain levels, leaving the analysis to other stakeholders. But the team does produce content to explain some of the trends it’s seeing in the data.
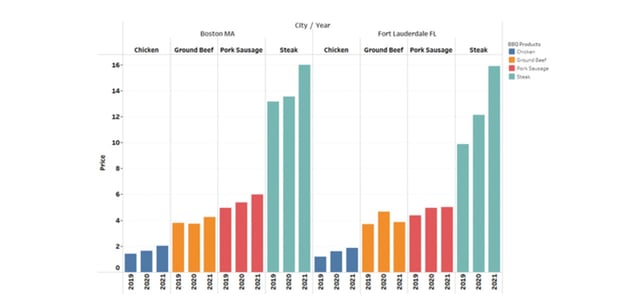
For example, the COLI team considered COVID-19 pandemic supply chain issues in a COLI BBQ Index published in fall 2021. It focused on the meat industry and found disruptions stemming from labor shortages, transportation disruptions, and distortions in supply and demand.
Prices were highest in Alaska and lowest in Mississippi, reflecting their proximity to livestock markets. But prices were disproportionately high in Missouri, defying expectations.

“I was surprised by that,” Allison said. “Missouri should be a place where you get nice, fresh meat, but it was wildly expensive.”
“There could be a labor shortage there, so even though they have this local market, maybe they’re having to import meat because there aren’t enough people to produce it,” Baines added.
Returning to a pre-pandemic labor market may restabilize meat prices in Missouri. But when COLI reveals chronically high prices in a particular metro area, job seekers need to pay attention.
COLI attaches real numbers to the common knowledge that New York, LA, and other megacities have much higher than average prices. And workers should take that into account when it’s time to negotiate.
“Texas sticks out as a place that people are flocking to,” Allison said. “You have access to cultural attractions in larger cities like Dallas, San Antonio, and Houston, but COLI shows that your cost of living is so much lower for what you’re getting.”
Advertiser Disclosure
CardRates.com is a free online resource that offers valuable content and comparison services to users. To keep this resource 100% free, we receive compensation for referrals for many of the offers listed on the site. Along with key review factors, this compensation may impact how and where products appear across CardRates.com (including, for example, the order in which they appear). CardRates.com does not include the entire universe of available offers. Editorial opinions expressed on the site are strictly our own and are not provided, endorsed, or approved by advertisers.


![11 Best Credit Cards With Price Protection ([updated_month_year]) 11 Best Credit Cards With Price Protection ([updated_month_year])](https://www.cardrates.com/images/uploads/2019/11/Credit-Cards-with-Price-Protection-Feat.jpg?width=158&height=120&fit=crop)
![7 Best Loans For Gig Workers ([updated_month_year]) 7 Best Loans For Gig Workers ([updated_month_year])](https://www.cardrates.com/images/uploads/2022/11/Loans-For-Gig-Workers.jpg?width=158&height=120&fit=crop)
![[card_field card_choice='68495' field_choice='title'] vs. [card_field card_choice='5909' field_choice='title'] ([updated_month_year] Comparison) [card_field card_choice='68495' field_choice='title'] vs. [card_field card_choice='5909' field_choice='title'] ([updated_month_year] Comparison)](https://www.cardrates.com/images/uploads/2018/02/chase2.png?width=158&height=120&fit=crop)
![4 Credit Card Comparison Charts: Rewards, Fees, Rates & Scores ([updated_month_year]) 4 Credit Card Comparison Charts: Rewards, Fees, Rates & Scores ([updated_month_year])](https://www.cardrates.com/images/uploads/2018/03/charts.png?width=158&height=120&fit=crop)
![Global Entry vs. TSA PreCheck vs. CLEAR: Credit Card Benefit Comparison ([updated_month_year]) Global Entry vs. TSA PreCheck vs. CLEAR: Credit Card Benefit Comparison ([updated_month_year])](https://www.cardrates.com/images/uploads/2023/02/Global-Entry-vs.-TSA-PreCheck-vs.-Clear.jpg?width=158&height=120&fit=crop)

![7 Costco Credit Card Benefits & Alternatives ([updated_month_year]) 7 Costco Credit Card Benefits & Alternatives ([updated_month_year])](https://www.cardrates.com/images/uploads/2022/03/Costco-Credit-Card-Benefits.jpg?width=158&height=120&fit=crop)
